|
Sensor
|
Accuracy
|
Autonomous
|
Price
|
Operation conditions
|
Disadvantages
|
|
Odometry
|
4×4
meters square path: smooth floor: 30 mm, 10 bumps:
500 mm
|
Yes
|
$30 and up
|
Smooth floor
|
Requires correction by other
sensors
|
|
Vision
|
Depends on camera properties and
lighting
|
No, it requires the presence of
landmarks
|
$20 and up
|
Daytime, otherwise requires
additional source of light
|
Requires presence of markers, can
make fail detection
|
|
Inertial Navigation System (INS)
|
Position drift rate: 1-8 cm/s
depending on frequency of acceleration change
|
Yes
|
$25000-$1000000
|
Non effective if there is often
system velocity change
|
Decrease in accuracy with time
|
|
Global Positioning System (GPS)
|
order of 20 m during motion, order
of a few meters when standing for minutes
|
Yes
|
$150-$5000
|
Earth area
|
Signal may black out
|
|
Range sensors
|
Accuracy depends on environment,
where sensor is used
|
No, it requires the presence of
landmarks
|
$30 and up
|
In wide variety of domains
|
Applicable only for certain type
of environment
|
1.1.4 Coordinate systems used in
SLAMmportant competence for a mobile
system is the ability to build and maintain maps of initially unknown
environments. Maps allow the vehicle to plan its movement
within the environment in order to achieve its goals. The automatic creation of
maps allows the vehicle to model the world using its sensory resources. In
some instances, the creation of an accurate map of the environment is a goal in
itself while in many other circumstances the maps are used as a tool for
performing other higher level tasks such as planning to achieve a goal or
coordinating the motion of multiple robots. Given accurate
positioning information, the creation of a map of the environment is a
straightforward undertaking. Given a current position estimate and an
observation of the environment the observation can be fused into the existing
map to create an updated map estimate. One of the simplest methods for
generating a map is to divide the environment into a grid consisting of cells
whose properties are recorded. These grid maps can
be used to indicate whether areas of the environment are occupied by obstacles
[18]. In
outdoor environments, grid cells can also encode other properties of the
terrain such as traversibility. Grid maps become computationally expensive for
large environments. Feature maps, on the other
hand, rely on the extraction of relevant environmental features with which to
build maps [16,
17]. Most feature maps consist of a set of landmarks and encode some
relationship between the features contained in the maps.work has been done to
improve the computational complexity of the classic SLAM problem. It was not
convenient to update the global map, as it required complex processing, that’s
why the submapping principle was introduced. Submapping has become highly
popular as a way of tackling large-environment SLAM. The aim was to
sufficiently reduce the complexity by operating within a smaller submap. The
submaps could possibly be merged into the global map after a period of time or
alternatively the submaps could remain separated.
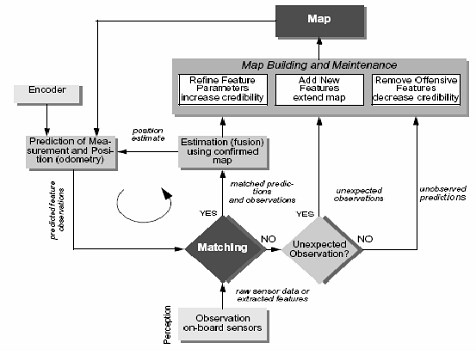 1.2 - Map
processing and updating principle, used in SLAM
1.2 - Map
processing and updating principle, used in SLAM
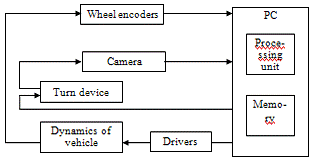
.2 Design of system of visual SLAM
consists of vehicle, turn device,
Personal Computer (processing unit and memory) and is equipped with a single
camera, used as a vision sensor, and odometry sensors providing dead reckoning
data. As odometry sensors standard wheel
encoders attached
to the driving wheels of a differential drive system may be used.
 1.3 - Operational
principle of VSLAM
1.3 - Operational
principle of VSLAM
VSLAM enables localization and
mapping single low-cost camera and dead reckoning to make visual measurements
of the environment. This technology is a major achievement in autonomous
navigation, enabling manufacturers to develop a new generation of useful robotic
products and devices with more intelligence than previously possible. With
VSLAM, a robot or device captures visual landmarks and uses them to build a map
of its environment. As the product moves through the area it has mapped, it
navigates based on recognized visual landmarks on its map.entering a new
environment, the VSLAM-enabled product can either load an existing map of that
area or start creating a new map. The product then continues to move, detect
old landmarks, create new landmarks, and correct its position information as
necessary using its map.
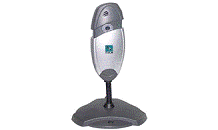
The navigation object is the robot,
which has four wheels and differential control. Speed is 5sm/sec.visual sensor
is represented by web camera. It is situated in the center of the robot (figure
1.4).
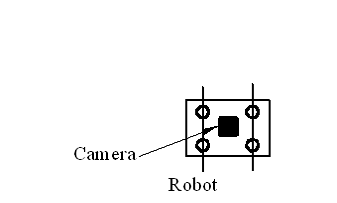
Figure 1.4 - Position of camera on
the robot body
simultaneous
localization mapping navigational
Camera works all the time. Robot
moves and investigates the environment continuously. It processes the obtained
pictures of environment every 5 seconds. If robot finds the object (or image),
that is similar (by some characteristics) to landmark, which is stored in robot
memory, it must check this object. Then the image is scanned and compared with
the true landmark using some image mapping methods.
Requirements to developed VSLAM are:
- to distinguish color
marker (or landmark) among other visual objects;
- to
determine the distance to the color marker (or landmark);
having the information on
vehicle location to determine the coordinates of the color marker (or
landmark);
update a stored map with
the new location information and landmarks;
organize submaps into one
global map.
.3 Problem statement of development
of localization algorithm
goal of this research project is to
prepare and design an outdoor mobile robot, which will use the principles of
VSLAM. So that it can be placed into an unknown environment, build the map of
this environment and navigate according to this map. In SLAM, both the
trajectory of the platform and the location of all landmarks are estimated
online without the need for any a priori knowledge of location.this purpose we
use two types of sensors: odometry and visual.
Odometry is the most widely used
navigation method for mobile robot positioning; it provides good short-term
accuracy, is inexpensive, and allows very high sampling rates. However, the
fundamental idea of odometry is the integration of incremental motion
information over time, which leads inevitably to the unbounded accumulation of
errors. Odometry is based on simple equations, which hold true when wheel
revolutions can be translated accurately into linear displacement relative to
the ground.sensors are applied for segmentation of picture and its further
morphological analyses. The result of this analysis is the separation of closed
color objects, and marking some of them as color landmarks. Color landmarks are
considered to be round closed spots of a certain size and color. Then with the
help of visual sensors and some calculations the distance to the object is
determined, knowing the parameters and characteristics of camera.the
information, obtained from sensors, it is possible to create VSLAM, and obtain
fully autonomous robot.we have to take into account that noisy
sensors make VSLAM to be a difficult problem. Every time the robot moves, it
relies on its sensors to compute the distance traveled. Since there is no such
thing as a noise-free sensor, there is always a small error associated with
every move. These errors add up very quickly and the robot becomes lost.
Correcting these errors is easy if a good map of the robot’s operating
environment is given; the robot can correct its estimated position by computing
its relative position to landmarks that are present in the map and currently
visible.error that arises due to odometry sensors will be compensated by means
of visual sensors. So these sensors verify each other in order to eliminate
error.
2. Review of possible solutions
.1.1 Vision sensorssensors produce
very rich data and many algorithms from the computer vision community are ready
to use and can be directly applied in robotic applications. Moreover vision
sensors bring together properties which are of main importance for SLAM. They
are low-cost sensors, small and power-saving and are therefore easy to embed on
a robotic platform. Also they perceive data with a large field of view, at high
frame rates and high resolutions.must differentiate monocular
vision and stereo
vision [15, 17]. A stereo head is composed of
two cameras; with these two images 3D data of the surrounding environment can
be recovered. But stereo-vision suffers from two main problems:
· Depending on the
baseline of the stereo-bench, 3D information is obtained up to a given depth;
this is an intrinsic limit of this sensor. For instance, it is very difficult
to endow an aerial robot with a stereo-bench which baseline is large enough to
get 3D information on the ground while flying at a reasonable altitude.
· A stereo-bench must
be calibrated so as to produce correct 3D information, and when it is used on a
vehicle it is prone to lose its calibration.these reasons, monocular vision was
chosen to develop my VSLAM system.
.1.2 Infrared (IR) range
sensorsgeneral IR sensors are small devices that can emit an infrared light and
sense the presence of an object using the IR-beam reflected from the object
itself [22]. Considering the robotics field and especially mobile robotics, IR
sensors have often been used as proximity sensors, with the task of detecting
obstacles.motion is detected when an infrared source with one temperature, such
as a human, passes in front of an infrared source with another temperature,
such as a wall.a sensor is composed of a sender and a receiver. Infra-red
sensors use triangulation and a small linear CCD array to compute the distance
and/or presence of objects in the field of view.basic behaviour of the Sharp IR
sensor is as follows:
– A pulse of IR light is
emitted by the emitter
– This light travels out in
the field of view and either hits an object or just keeps on going
– In the case of no object,
the light is never reflected and the reading shows no object
– If the light reflects off an
object, it returns to the detector and creates a triangle between the point of
reflection, the emitter, and the detector
– The angles in this triangle
vary based on the distance to the object
– The receiver portion of the
detector is a precision lens that transmits the reflected light onto various
portions of an enclosed linear CCD array based on the angle of the triangle
described above
– The CCD array can then
determine what angle the reflected light came back at and therefore, it can
calculate the distance to the object.
.1.3 Ultra-sound range
sensorssensors [9] work on a principle similar to radar or sonar which
evaluates attributes of a target by interpreting the echoes from radio or sound
waves respectively. Ultrasound sensors generate high frequency sound waves and
evaluate the echo which is received back by the sensor. Sensors calculate the
time interval between sending the signal and receiving the echo to determine
the distance to an object.a packet of (ultrasonic) pressure waves. Distance d
of the echoing object can be calculated based on the propagation speed of sound
c and the time of flight t as follows:
 (2.1)
(2.1)
speed of sound c (340 m/s) in air is
given by
 (2.2)
(2.2)
:
γ
- ratio of specific heats- gas constant- temperature in degrees Kelvin
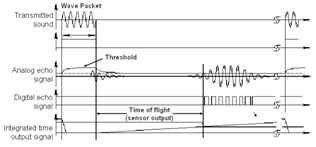 2.1 - Wave
processing by ultra-sound range sensor
2.1 - Wave
processing by ultra-sound range sensor
frequency: 40 - 180 kHz. Sound beam
propagates in a cone like manner:
- Opening angles around 20 to
40 degrees
- Regions of constant depth
Segments of an arc (sphere
for 3D)
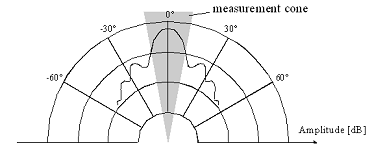 2.2 - Distribution
of wave by ultra-sound range sensor
2.2 - Distribution
of wave by ultra-sound range sensor
problems for ultrasonic sensors:
- Soft surfaces that
absorb most of the sound energy
- Surfaces that are far from
being perpendicular to the direction of the sound - specular reflection.
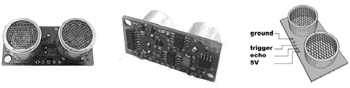 2.3 - The SRF04
ultrasound sensor
2.3 - The SRF04
ultrasound sensor
.1.4 Other sensorssensors
Odometry is the most widely used
navigation method for mobile robot positioning; it provides good short-term
accuracy, is inexpensive, and allows very high sampling rates [12]. However,
the fundamental idea of odometry is the integration of incremental motion
information over time, which leads inevitably to the unbounded accumulation of
errors. Specifically, orientation errors will cause large lateral position
errors, which increase proportionally with the distance travelled by the robot.
Despite these limitations, most researchers agree that odometry is an important
part of a robot navigation system and that navigation tasks will be simplified
if odometric accuracy can be improved.compassesheading is the most significant
of the navigation parameters (x, y, and Θ)
in terms of its influence on accumulated dead-reckoning errors. For this
reason, sensors which provide a measure of absolute heading are extremely
important in solving the navigation needs of autonomous platforms. The magnetic
compass is such a sensor. One disadvantage of any magnetic compass, however, is
that the earth's magnetic field is often distorted near power lines or steel
structures [Byrne et al., 1992]. This makes the straightforward use of
geomagnetic sensors difficult for indoor applications. Based on a variety of
physical effects related to the earth's magnetic field, different sensor
systems are available [19]:
· Mechanical magnetic
compasses.
· Fluxgate compasses.
· Hall-effect
compasses.
· Magnetoresistive
compasses.
· Magnetoelastic
compasses.compass best suited for use with mobile robot applications is the
fluxgate compass. When maintained in a level attitude, the fluxgate compass
will measure the horizontal component of the earth's magnetic field, with the
decided advantages of low power consumption, no moving parts, intolerance to
shock and vibration, rapid start-up, and relatively low cost. If the vehicle is
expected to operate over uneven terrain, the sensor coil should be
gimbal-mounted and mechanically dampened to prevent serious errors introduced
by the vertical component of the geomagnetic field.
 2.4 - The C-100
fluxgate compass engine
2.4 - The C-100
fluxgate compass engine
2.2 Analysis of feature extraction
methods
.2.1 Color spaces
RGB (red, green, and blue) refers to
a system for representing the colors to be used on a computer display [19].
Red, green, and blue can be combined in various proportions to obtain any color
in the visible spectrum. Levels of R, G, and B can each range from 0 to 100
percent of full intensity. Each level is represented by the range of decimal
numbers from 0 to 255 (256 levels for each color), equivalent to the range of
binary numbers from 00000000 to 11111111, or hexadecimal 00 to FF. The total
number of available colors is 256 x 256 x 256, or 16,777,216 possible colors.
 2.5 - RGB Color
space
2.5 - RGB Color
space
(short for cyan, magenta, yellow,
and key (black), and often referred to as process color or four color) is a
subtractive color model, used in color printing, also used to describe the printing
process itself. Though it varies by print house, press operator, press
manufacturer and press run, ink is typically applied in the order of the
acronym. The CMYK model works by partially or entirely masking certain colors
on the typically white background (that is, absorbing particular wavelengths of
light). Such a model is called subtractive because inks "subtract"
brightness from white.additive color models such as RGB, white is the
"additive" combination of all primary colored lights, while black is
the absence of light. In the CMYK model, it is just the opposite: white is the
natural color of the paper or other background, while black results from a full
combination of colored inks. To save money on ink, and to produce deeper black
tones, unsaturated and dark colors are produced by substituting black ink for
the combination of cyan, magenta and yellow.

Figure 2.6 - CMYK Color model

Lab color space
stands for Luminance (or lightness) and A and B (which are chromatic
components). According to this model A ranges from green to red, and B ranges
from blue to yellow. This model was designed to be device independent. In other
words by means of this model you can handle colors regardless of specific
devices (such as monitors, printers, or computers). The Luminance ranges from 0
to 100, the A component ranges from -120 to +120 (from green to red) and the B component
ranges from -120 to +120 (from blue to yellow).
Unlike the RGB and CMYK color
models, Lab color is designed to approximate human vision. It aspires to
perceptual uniformity, and its L component closely matches human perception of
lightness. It can thus be used to make accurate color balance corrections by
modifying output curves in a and b components, or to adjust the lightness
contrast using the L component. These transformations are difficult or
impossible in the RGB or CMYK spaces, which model the output of physical
devices, rather than human visual perception.
|
RGB
|
Red, Green and Blue
|
RGB model creates colors by adding
light; it is called an additive color model. Art of reproducing color by
adding 3-primary RGB-colors in varying proportions is called ADDITIVE mixing.
|
|
CMYK
|
Cyan, Magenta, Yellow and Black
|
CMYK color model creates colors by
absorbing light; it is called a subtractive color model. CMYK-model is
narrower than RGB. CMYK are the 3-primary colors used in SUBTRACTIVE mixing.
When CMY-colors are mixed, it produces BLACK or COMPOSITE BLACK (CMYK).
|
|
LAB
|
Luminance and two chromatic
components: A - green to magenta B - blue to yellow
|
LAB or Lab (CIE L*a*b) is a color
model created by the Commission Internationale de l'Eclairage (CIE). It
contains a luminance (or lightness) component (L) and two chromatic
components: "a" (green to red (or magenta)) and "b" (blue
to yellow). The Lab color space is based on the Lab color model.
|
.2.2 Color segmentation methods
A central problem, called
segmentation is to distinguish objects from background. Image segmentation
refers to the partitioning of image pixels into meaningful regions.
Segmentation is often the first step in image analysis. For intensity images
(i.e., those represented by point-wise intensity levels) four popular
approaches are: threshold techniques, edge-based methods (or boundary-based
segmentation rely on region edges for segmentation), region-based techniques
(or region-based segmentation rely on interior pixels for segmentation), and
connectivity-preserving relaxation methods.techniques, which make decisions
based on local pixel information, are effective when the intensity levels of
the objects fall squarely outside the range of levels in the background.
Because spatial information is ignored, however, blurred region boundaries can
create havoc.technique is based upon a simple concept
[21]. A parameter  is
called the brightness threshold is chosen and applied to the image a [m, n] as
follows:
is
called the brightness threshold is chosen and applied to the image a [m, n] as
follows:
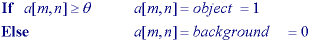
version of the algorithm assumes
that there is an interest in light objects on a dark background. For dark
objects on a light background the following algorithm is used:
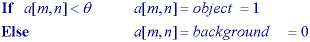
output is the label
"object" or "background" which, due to its dichotomous
nature, can be represented as a Boolean variable "1" or
"0".
 2.8 - Color
segmentation method, using threshold techniques
2.8 - Color
segmentation method, using threshold techniques
based methods center around contour
detection: their weakness in connecting together broken contour lines make
them, too, prone to failure in the presence of blurring.region-based method
usually proceeds as follows: the image is partitioned into connected regions by
grouping neighboring pixels of similar intensity levels. Adjacent regions are
then merged under some criterion involving perhaps homogeneity or sharpness of
region boundaries. Overstringent criteria create fragmentation; lenient ones
overlook blurred boundaries and overmerge. Hybrid techniques using a mix of the
methods above are also popular.of region-based method procedure:
· Regions have
already been defined before.
· A complete
segmentation of an image  is a finite set of
regions
is a finite set of
regions ,
,
 if i¹j
S is the total number of regions in
the image.
· Further
assumptions needed in this section are that regions must satisfy the following
conditions:
 for i=1, …, S and
 for i¹j
and
for i¹j
and  is
adjacent to
is
adjacent to  ,
,
 is a binary
homogeneity evaluation of the region.
is a binary
homogeneity evaluation of the region.
· While the region
growing methods discussed below deal with two-dimensional images,
three-dimensional implementations are often possible. Considering
three-dimensional connectivity constraints, homogeneous regions (volumes) of a
three-dimensional image can be determined using three-dimensional region
growing.connectivity-preserving relaxation-based segmentation method, usually
referred to as the active contour model, was proposed recently. The main idea
is to start with some initial boundary shapes represented in the form of spline
curves, and iteratively modify it by applying various shrink/expansion
operations according to some energy function. Although the energy-minimizing
model is not new, coupling it with the maintenance of an "elastic"
contour model gives it an interesting new twist. As usual with such methods,
getting trapped into a local minimum is a risk against which one must guard;
this is not easy task.
.2.3 Geometric feature determination
methodsfeatures determination method is used together with the color
segmentation method in order to provide results with higher accuracy. This
method is based on primary knowledge of geometric features of landmarks. So, to
perform such type of analyses markers should be chosen with distinctive shape
(like circle, square, triangle etc.). In our investigation was chosen circular
shape of markers for further use of such characteristics as eccentricity, area,
mass center.is very convenient to process image in binary (or grayscale) mode,
as image looses the information about the colored features of environment, but
edges of all elements, which are present on the image, are well distinguished.
This binary image can be easily obtained after image segmentation and further
processing, supposing that white color corresponds to the current color of
object and black one corresponds to background.order to receive higher accuracy
of the investigation simple method of noise filtering has to be applied. This
method grounds on the morphological analyses of objects, considering that the
area of the object is higher than the boundary value of noise (this boundary
value can be set in the program). The area S of objects is calculated by the
summation of all pixels, with white color.  .
In order to calculate eccentricity for ellipse, described by equation
.
In order to calculate eccentricity for ellipse, described by equation  ,
I used the next expression
,
I used the next expression  . Where, in
particular, for circle eccentricity equal to 0 and for ellipse eccentricity
lies in the range between 0 and 1.each object there exists a label matrix, with
such object parameters as index, area, eccentricity, orientation (relatively to
x axes of image), mass center coordinates (in terms of x,y image), color index
of object. Parameters, mentioned above, are checked for the correspondence to
the set object’s parameters. In the case disparity objects are considered to be
error, and are filtered. If during some period of time at least one parameter
keeps it value stable, the object is said to be such that can be used during
the visual positioning.
. Where, in
particular, for circle eccentricity equal to 0 and for ellipse eccentricity
lies in the range between 0 and 1.each object there exists a label matrix, with
such object parameters as index, area, eccentricity, orientation (relatively to
x axes of image), mass center coordinates (in terms of x,y image), color index
of object. Parameters, mentioned above, are checked for the correspondence to
the set object’s parameters. In the case disparity objects are considered to be
error, and are filtered. If during some period of time at least one parameter
keeps it value stable, the object is said to be such that can be used during
the visual positioning.
.3 Analysis of localization methods
.3.1 Extended Kalman Filter (EKF)
The Kalman filter is an efficient
recursive filter that estimates the state of a dynamic system from a series of
incomplete and noisy measurements. This meansonly the estimated state from the
previous time step and the current measurement are needed to compute the
estimate for the current state. In contrast to batch estimation techniques, no
history of observations and/or estimates is required.
While the EKF has become the
dominant approach to SLAM, it suffers from two problems that complicate its
application in large, real-world environments: quadratic complexity and
sensitivity to failures in data association.first drawback of the EKF as a
solution to the SLAM problem is computational complexity. Both the computation
time and memory required by the EKF scale quadratically with the number of
landmarks in the map [23, 4, 10], limiting its application to relatively small
maps. Quadratic complexity is a consequence of the Gaussian representation
employed by the EKF. The uncertainty of the SLAM posterior is represented as a
covariance matrix encoding the correlations between all possible pairs of state
variables. In a two-dimensional world, the covariance matrix contains 2N + 3 by
2N + 3 entries, where N is the total number of landmarks in the map. Thus, it
is easy to see how the memory required to store this covariance matrix grows
with N2.
The second problem with EKF-based
SLAM approaches is related to data association, the mapping between
observations and landmarks. In the real world, the associations between observations
and landmarks are hidden variables that must be determined in order to estimate
the robot pose and the landmark positions.standard approach to data association
in EKFs is to assign every observation to a landmark using a maximum likelihood
rule; i.e. every observation is assigned to the landmark most likely to have
generated it. If the probability of an observation belonging to an existing
landmark is too low, it is considered for inclusion as a new landmark. Since
the EKF has no mechanism for representing uncertainty over data associations,
the effect of incorporating an observation given the wrong data association can
never be undone. If a large number of readings are incorporated incorrectly
into the EKF, the filter will diverge.computational and memory requirements of
the EKF make this approach infeasible for the SLAM problem.
.3.2 Rao-Blackwellized Filter,
Doucet, and colleagues [27] introduced Rao-Blackwellized particle filters
(RBPF’s) as an effective means to solve the SLAM problem. The main problem of
Rao-Blackwellized particle filters lies in their complexity, measured in terms
of number of particles required to learn an accurate map. Either reducing
quantity or improving the algorithm so that it is able to handle large sample
sets is one of the major challenges for this family of algorithms.key idea of
the Rao-Blackwellized particle filter for SLAM is to estimate the joint
posterior p(x1:t ,m | z1:t, u1:t-1) about the
trajectory x1:t = x1, . . . , xt of the robot
and the map m of the environment given the observations z1:t = z1,
. . . , zt and odometry measurements u1:t-1 = u1,
. . . , ut-1. It does so by using the following factorization
 (2.3)
(2.3)
this equation, the posterior p(x1:t
| z1:t , u1:t-1) is similar to the localization problem,
since only the trajectory of the vehicle needs to be estimated. This estimation
is performed using a particle filter which incrementally processes the
observations and the odometry readings as they are available. The second term
p(m | x1:t , z1:t ) can be computed efficiently since the
poses x1:t of the robot are known when estimating the map m. As a
result of the factorization, a Rao-Blackwellized particle filter for SLAM
maintains an individual map for each sample and updates this map based on the
trajectory estimate of the sample upon "mapping with known poses".
.3.3 Conclusionsthorough
investigation of all possible solutions the web-camera A-4 Tech PK-635 was
chosen as a vision sensor, because of its technical characteristics:
sufficiently high resolution, capture speed and low cost.order to process the
image methods of image segmentation and of geometric feature extraction were
applied, as combination of these methods gives high accuracy of
investigation.analyses of EKF and RBPF I made a conclusion that these filters
are complex for making the analyses of surrounding environment and require
powerful computer complex, that’s why I decided to use range measurement
algorithm, in order to localize and position robot in surrounding environment.
3. Development of visual system of
SLAM
.1 Selection of technical means of
developed system
.1.1 Vision sensor used in developed
systemcamera description
 3.1 - Web-camera
A-4 Tech PK-635, 350К pixels
3.1 - Web-camera
A-4 Tech PK-635, 350К pixels
Name: A4 Technology: A4Tech PK-635
Camera Driver Windows 9x/ME/2000/XP/2003System: Windows 9x/ME/2000/XP/2003
Description: A4Tech PK-635 Camera Driver Windows 9x/ME/2000/XP/2003. Design:
Movable protective cover of the objective, flexible support Viewing angle is
54°CMOS, 300K pixelsrate is 30 fpsis automatic: button of the snap receivingis
640×480to the
object - from 10 cm- USB 1.1in microphone: is present
3.1.2 On-board computer selectionare
the hardware and software requirements for the given project:
1. CPU = 1.666Hz
2. Memory = 128Mb
. Videocard = 64Mb
. Monitor (17")
. Web-camera (robot onboard)
. Operating system = Windows
2000/XP
. LPT-port must be present
and work in computer.
. Compiler of language C in
Matlab
.2 Development of color segmentation
algorithm
.2.1 Algorithm of image color
segmentationfirst step is to classify each pixel using the Nearest Neighbor
Rule. Each color marker now has 'a' and a 'b' value. It is necessary to
classify each pixel in the image by calculating the Euclidean distance between
that pixel and each color marker. The smallest distance will show that the
pixel most closely matches that color marker. For example, if the distance
between a pixel and the second color marker were the smallest, then the pixel
would be labeled as that color.that the results of nearest neighbor
classification can be displayed. For this the label matrix is created and it
contains a color label for each pixel in the image. We use the label matrix to
separate objects in the original image by color.next step is to check and
analyze the reaction of our system on different colors using the values of
color markers.
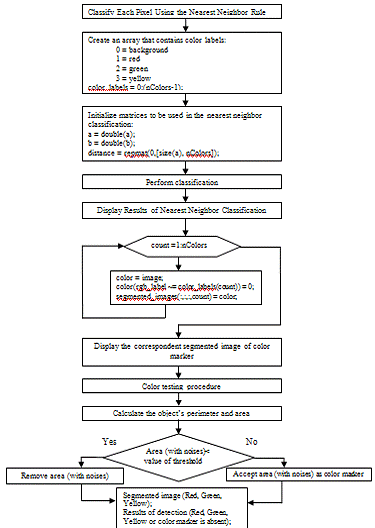 3.2 - Block diagram
of image color segmentation algorithm
3.2 - Block diagram
of image color segmentation algorithm
we must calculate the object’s
perimeter and area, and using these information compute the roundness metric.
After that we set the threshold of metric, and compare metric of all closed
objects specified metric in order to exclude objects that are not related to
the markers. It is necessary to remove area, which has the form different to
circular one.next step is to remove closed objects with area less than set
threshold that are considered to be noises.
.2.2 Investigation of factors, which
influence on color indexit was mentioned before, L*a*b color model grounds on 3
components of color: "L" (which is luminance or lightness),
"a" (chromatic component green to magenta), and "b"
(chromatic component blue to yellow). It was supposed that luminance component
determines lightness of the current image, and doesn’t contain information
about the color parameters. Based on this assumption the segmentation algorithm
was developed, which illustrated the next results (segmentation was made for
red, green and yellow colors by means of "a" and "b" color
components).
 3.3 - Snapshot,
made by web camera
3.3 - Snapshot,
made by web camera
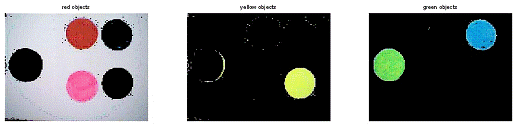 3.4 - Results of
segmentation for red, green and yellow colors, considering "a" and
"b" components of color
3.4 - Results of
segmentation for red, green and yellow colors, considering "a" and
"b" components of color
is visible from received results
that segmentation procedure doesn’t give the required results and accuracy.next
step was to analyze histogram of color distribution in the current image.
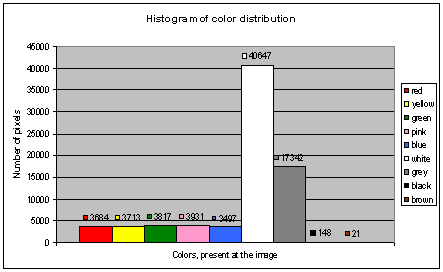 3.5 - Histogram of
color distribution at the image, represented by figure 15
3.5 - Histogram of
color distribution at the image, represented by figure 15
is visible from the histogram that
the greatest number of pixels belongs to background (white and grey colors),
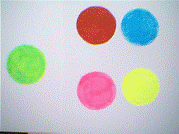
and there are 5 colors, which are above threshold value (that is 500 pixels).
These colors are: red, yellow, green, pink and blue. Also there are 2 colors,
which are below threshold value, which means that the number of pixels of these
colors is very low.the investigation, it was noticed that for the same color
marker lightness component changes with the change in background color. This
means that lightness has also to be taken into account when determining color
index. The following table partially shows the results, obtained during the
investigation.
3.1 - Values of color components for
red, green and yellow colors at different backgrounds
|
Background
|
RED
|
GREEN
|
YELLOW
|
|
L
|
a
|
b
|
L
|
a
|
b
|
L
|
a
|
b
|
|
White
|
83
|
167
|
159
|
204
|
86
|
181
|
245
|
110
|
207
|
|
Black
|
143
|
177
|
162
|
211
|
83
|
181
|
246
|
112
|
195
|
|
Red
|
165
|
157
|
217
|
72
|
172
|
237
|
97
|
192
|
|
Orange
|
99
|
168
|
155
|
190
|
74
|
172
|
229
|
93
|
185
|
|
Mixed
|
104
|
178
|
167
|
222
|
82
|
167
|
226
|
106
|
195
|
That’s why the next step was to add
"L" component and to consider segmentation, having information not
only about red, green and yellow colors, but also about pink, blue and 2 colors
of background (white, grey). Results were the next:
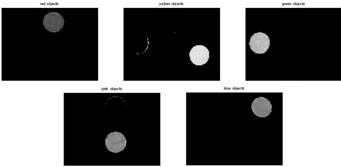 3.6 - Results of
segmentation for red, green, yellow, pink, blue, white and gray colors,
considering "a", "b" and "L" components of color
3.6 - Results of
segmentation for red, green, yellow, pink, blue, white and gray colors,
considering "a", "b" and "L" components of color
results, illustrated in figure 3.6
we can make a conclusion that for the best segmentation results we have to
consider a number of colors, present at the image, and quantity of each color,
i.e. how many pixels of each color are present at the current image. After 20
experiments, similar to those, represented at figures 3.3-3.6, it was made a
conclusion that it is highly recommended to define a number of colors, which
exceed the threshold value in the histogram of color distribution, i.e. colors
which are mostly present at the current image. And, considering this
information, perform image segmentation by previously defined colors. This
principle will significantly improve accuracy of segmentation, and, as a
result, decrease error during positioning. As it was illustrated at the figure
3.4, accuracy of segmentation is rather poor, as all colors, which are above
the threshold value, are not considered. The figure 3.6 shows the results of
segmentation, which takes into account all colors, above threshold value. And,
comparison of obtained results proves that accuracy of segmentation for figure
3.6 is much higher than for figure 3.4.
3.3 Development of algorithm of
geometric characteristics determination
.3.1 Transformation from L*a*b into
binary formthe segmentation procedure I obtained image, in which black color
corresponds to background color of image and other colors - to segmented ones.
 3.7 - Image after
segmentation
3.7 - Image after
segmentation
is more convenient to determine
geometric features of objects having binary image. So, the next step was to
transform L*a*b image into binary one. The next algorithm was used for this
transformation.
 3.8 - Block diagram
of transformation form L*a*b into binary form algorithm
3.8 - Block diagram
of transformation form L*a*b into binary form algorithm
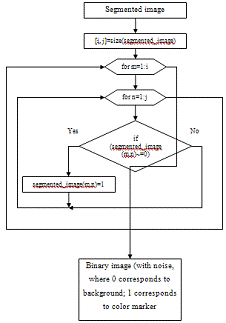
3.3.2 Geometric characteristics
determinationorder to improve the accuracy after color segmentation procedure,
method of geometric features determination is applied. So, after the color
segmentation the image is transformed into binary image, where 1 corresponds to
color marker (white color) and 0 corresponds to background color of image
(black color). In the algorithm threshold value of noise was introduced, which
is important with the purpose to filter small noises, which appear on the
image. The next step is to calculate such parameters of each obtained object,
as area and roundness.is well known that the roundness of a circle corresponds
to 1, and the roundness of ellipse may be in range from 0 to 1. Taking into
account errors, obtained due to transformation from L*a*b into binary image, it
is understandable that the circle is not perfect, and roundness will lie in
range from 0 to 1.order to filter object that are not even close by their shape
to circle I set the threshold of roundness, which means that all objects with
roundness less than the threshold value will be filtered out and considered to
be errors, obtained after image segmentation.
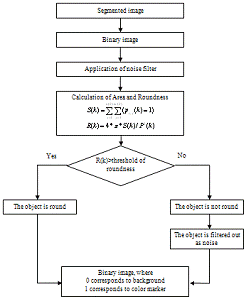 3.9 - Block diagram
of geometric characteristics determination algorithm
3.9 - Block diagram
of geometric characteristics determination algorithm
If the object will keep at least one
it’s parameter during the process of motion then this object is considered to
be such, which can be used during visual positioning.
.4 Localization algorithm
.4.1 Local coordinate systemthe
figure 3.10 is illustrated the local coordinate system of camera and its Field
Of View (FOV). It
shows the top and side views of a robot (not to scale). Notice that there is a blind
area immediately in front of the robot. Also, the top of the camera image in
this diagram is above the true horizon (the horizontal line through the centre
of the camera). In general, the horizon is not at the centre of the image
because the camera is tilted downwards to improve the visibility of the
foreground.
 3.10 - Local
coordinate system of camera, and camera FOV
3.10 - Local
coordinate system of camera, and camera FOV
the FOV diagram
[4, 6], α is
one-half of the vertical FOV; γ is one-half of the horizontal FOV; and
δ is the camera tilt angle. (γ and α
are related through the aspect ratio of the camera, which is usually 4:3 for
conventional video cameras.) If the image resolution is m by n pixels, then the
values of the image coordinates (u,v) will range from 0 to (m-1) and 0 to (n-1)
respectively.ider rays from the camera to points on
the ground corresponding to successive scanlines in the camera image. Each
pixel in this vertical column of the image corresponds to an angle of
2α/(n-1). Similarly, pixels in the horizontal direction correspond to an
arc of 2γ/(m-1).
The following relationships can be
easily determined from the diagram:
α + β + δ = 90 (3.1)
tan(β) = b / h (3.2)
tan(α + β) = (b + d) / h (3.3)
tan(γ) = w / (b + d)(3.4)
values of b, d and w can be
measured, although not very accurately (to within a few millimeters) by placing
a grid on the ground, and h can be measured directly. For any arbitrary image
vertical coordinate, v, the distance along the ground (y axis) can be calculated
using the following formula (Equation 3.5). Note that, by convention, the
vertical coordinates, v, in an image actually count downwards from the top.
This affects the formula.
y = h tan( β + 2α (n - 1 - v)
/ (n - 1) ) (3.5)
If α
is sufficiently large, then eventually y will progress out to infinity, and
then come backwards from minus infinity. (This is a result of the tan function,
but in geometrical terms it means that a ray through the camera lens intersects
the ground behind the camera.) On the other hand,
a larger tilt angle, δ, will reduce β so that y will never reach
infinity, i.e. a ray corresponding to the top of
the image will hit the ground.calculated y, the x value corresponding to the u
coordinate is:
x = y tan(
γ (2u - m + 1) / (m - 1) ) (3.6)
is the distance along the x axis,
which is the measured at right angles to the centre line of the robot and can
therefore be positive or negative. Notice that x depends on both u and v
because of the perspective transformation.the four parameters (b, d, h and w),
these calculations only need to be performed once for a given camera geometry,
and a lookup table of corresponding (x,y) values can be constructed for all
values of (u,v) in the image. (Note that the y value will approach infinity, so
that above a certain v value it becomes irrelevant.) This makes re-mapping of
image pixels for the inverse perspective mapping very quick, and the boundary
line between the floor and the obstacles can easily be drawn onto a map using
Cartesian coordinates with a known scale.
Similarly, a table can be constructed to
map pixel locations into polar coordinates, (r,θ).
Mapping the obstacle boundary into this polar space produces the Radial
Obstacle Profile, ROP. The advantage of the ROP as a representation is that
rotations of the camera are equivalent to a linear sliding of the ROP to the
left or right, making it easy to predict what the ROP should look like after
the robot has rotated on the spot, e.g. as part of performing a 360o
sweep.
.4.2 Positioning in 2D case for 1
landmarkcoordinate system (X,Y) is depicted on the figure below. The local
coordinate system of a robot [10] is (Xr,Yr), where (xr,yr)
are coordinates of the mass center of robot and (xf,yf)
are the coordinates of a color marker.
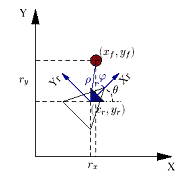
Figure 3.11 - Local and global
coordinate systems for positioning in 2D in case for 1 landmark
the nonlinear observability analysis
it is convenient to introduce polar coordinates for the relative state [ ],
],
 (3.7)
(3.7)
 (3.8)
(3.8)
 is the distance
between the vehicle and a landmark and
is the distance
between the vehicle and a landmark and  is
the bearing of the landmark with respect to the vehicle considering vehicle
orientation,
is
the bearing of the landmark with respect to the vehicle considering vehicle
orientation,  is the angle
between Xr and X. Figure 3.11 illustrates the vehicle landmark configuration in
the global and in the relative frames.
is the angle
between Xr and X. Figure 3.11 illustrates the vehicle landmark configuration in
the global and in the relative frames.
.4.3 Positioning in 2D case for 2
landmarkslocal coordinate system (X,Y) is depicted on the figure below [10].
Two markers with the coordinates (Xm1,Ym2) and (Xm2,Ym2) correspondingly and a
robot with coordinates (Xr,Yr) are shown on the figure.
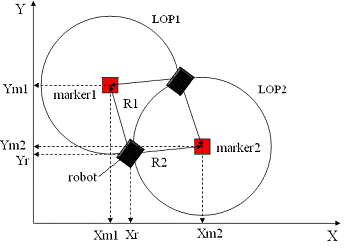 3.12 - Local and
global coordinate systems for positioning in 2D in case for 2 landmarks
3.12 - Local and
global coordinate systems for positioning in 2D in case for 2 landmarks
following system of equations has
been obtained:
 (3.9)
(3.9)
two markers are in the line of sight
of the robot, the line of positions of the first and the second markers are
intersected, then there are two possible positions of the robot. But one of the
possible positions we can neglect. The distances from the robot to the first
and the second marker are R1 and R2 correspondingly. The coordinates of the
object are determined in local coordinate system. The line of position is a
circle, the center of which is the coordinates of marker. It is possible to
define the distance R from the detected marker. The given navigation system
gets the data of the template of marker from the correlation extremal
navigation system. Robot moves and tracks the environment. When the nearest
marker is in the line of sight of the robot, it detects this marker. Robot
defines which of the color markers from the database in its memory just have
been detected. Knowing the color and the marker, the number of pixels of the
color marker is calculated and the distance from the robot to the detected
marker is determined.
4. Software development for visual
SLAM system
.1 Input data of program
is necessary for the program the
following input data:
- real time video (30 fps, color
image, format video - .avi, resolution 640×480);
developed program detects
distinctive objects of environment and determines distance from the robot to
detected color marker.D has real type and the following format of
representation: XX.XXXX.
.3 Description of software block
diagram
description of the developed
algorithm:
1. Video loading.
2. Image segmentation
procedure.
. Determination of the color
of the marker.
. Morphological analyses of
the image.
. Determination of geometric
parameters of color marker.
. Noise filtering.
. Determination of the distance
to the detected color marker.
. Output of the distance to
the detected color marker.
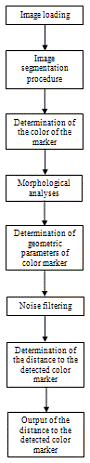 4.1 - Software
block diagram
4.1 - Software
block diagram
.4 User manual
are the minimal hardware and
software requirements for the given project:
1. CPU = 1.666Hz
2. Memory = 128Mb
. Videocard = 64Mb
. Monitor (17")
. Web-camera (robot onboard)
. Operating system = Windows
2000/XP
. LPT-port must be present
and work in computer.run the program it is necessary to load file
"Vis_marker_system.exe".
 4.2 - User’s manual
of the program
4.2 - User’s manual
of the program
of programs consists of several
elements:
- Button "Start
camera";
- Area "Primary image
obtained by web camera";
Area "Distance to
object determination by means of web camera";
Area "Distance
calculations";
Area "Histogram of
color distribution in the current image";
Buttons, which correspond
to the color of the color marker.button "Start camera" is used for
loading the real time video. "Primary image obtained by web camera"
represents the input image and the results of real time video processing and is
placed at the left lower corner of the program interface."Distance to
object determination by means of web camera" is used for reflection of
results, obtained after image processing."Distance calculations"
shows the distance to the color marker (red, green or yellow) in cm and the
robot coordinates., which correspond to the color of the marker, are used to
display the color of the image, which was distinguished by the system.
.5 Test example
. Run the program
"Vis_marker_system.exe" from the folder "Prog".
.Click on the button "Start
camera" to display the real time video. The picture of real time video
appears at the left lower corner and segmented images - at the right top of the
program interface. If the color marker is detected, the corresponding processed
image will appear at the top of the program interface, and the distance to the
color marker will be displayed in the box, located in the area "Distance
calculations". The buttons will display the color of the image, which was
distinguished by the system. In the right bottom angle will appear a histogram
of color distribution in the current image.
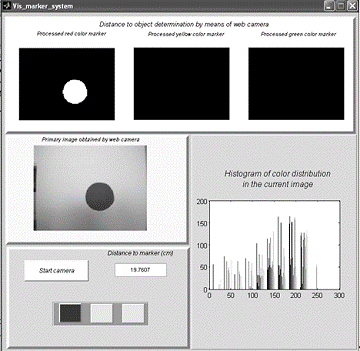 4.3 - Test example
of the program
4.3 - Test example
of the program
Conclusions
Modern
methods and
means of
navigation
for the
autonomous
mobile robot
have been
analyzed
in the
given work.
Matching to distinctive objects of
the surrounding environment (including visual features) is used in different
spheres, for example at solution of tasks of simultaneous localization and
mapping, known as SLAM (Simultaneous Localization And Mapping). The goal of
this work was to analyze different methods and means of visual positioning and
to create a system for autonomous mobile robot, which would be able to separate
distinctive objects of the environment, determine distance to these objects and
position itself, relatively to these objects. Under distinctive objects we
understand objects, which have certain color and geometrical
characteristics.task has been realized using the color segmentation of current
image, which is based on L*a*b color model. In order to make the analyses of
geometric features of separated objects, binary (black-white) image processing
methods were applied. Also, calibration of camera was made with the purpose to
determine distance to color markers. . Sets of experiments have been carried
out in order to determine the factors which influence on color index and
correspondingly on accuracy of segmentation. The results are the next: primary
step before image segmentation has to be determination of colors, above
threshold value, i.e. colors, which are dominantly present at the current
image, and based on this fact perform further image segmentation procedure.of
the given task have proved the required accuracy and good reliability.developed
algorithm can be used in the different branches of the manufacture. It reduces
the time of work performance, provides simplicity and increases the
reliability.